Special update on cold front thunderstorms

Hello everyone. The first cold front of the season is approaching fast, but not before a squall line of thunderstorms comes barreling through south Florida tonight and into early tomorrow morning.


RADAR OVERVIEW

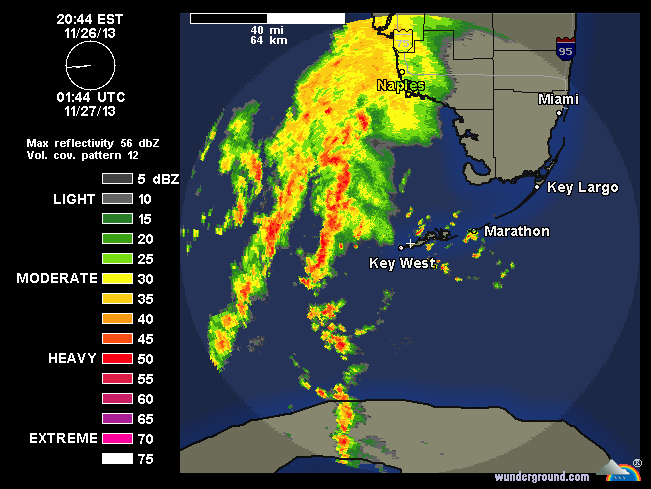
Figure 1. Radar observation from KEYW in Key West, FL at 8:44 PM.

Figure 1. Radar observation from KEYW in Key West, FL at 8:44 PM.


The latest series of radar passes shows a long line of strong to severe thunderstorms a good 50 miles offshore from the west coast of south Florida. The current forward speed of the overall system is roughly to the ENE at 25 mph, losing some of its pace from earlier. The combination of this forward speed and current position situates the line about two hours from Collier and Glades counties and about 3-4 hours from impacting the east coast areas such as Miami-Dade, Broward, and Palm Beach counties. Offshore buoys have measured rainfall rates as high as two inches per hour in some of these cells along with frequent lightning and high winds. At the current speed, below are the expected arrival times for the storms:

Collier county:

Coastal/Metro: 10:15-10:30 PM

Inland:  10:45-11:00 PM

Miami-Dade:

Everglades: 11:45 PM- 12:00 AM

Metro: 12:15-12:30 AM

Coastal: 12:45 AM-1:00 AM

Broward:

Inland:   12:00 AM- 12:15 AM

Metro:    12:15 AM- 12:30 AM

Coastal:  12:45 AM-1:00 AM

Palm Beach:

Inland:   12:00 AM- 12:15 AM

Metro:    12:15 AM- 12:30 AM

Coastal:  12:45 AM-1:00 AM


Also notice how there is a second line behind the main line. That also has the potential for organization and will affect the areas about an hour or two after the initial line passes. As far the cold front is concerned, the front will pass through tomorrow morning. Expect temperatures to stay steady during the morning and early afternoon hours and begin to fall as the afternoon and evening progresses. Winds are expected to shift to the northwest at night and that will move the cooler air towards us. Stay tuned for updates on Twitter.


2013 South Florida Rainy Season Recap

Hello everyone. It is safe to say that the dry season is running at full force. Nevertheless, it was quite an interesting rainy season over south Florida this year, with a rather unique spread of rainfall across both sides of the area. So, how much rain did south Florida actually receive during the rainy season?

2013 Rainy Season Recap

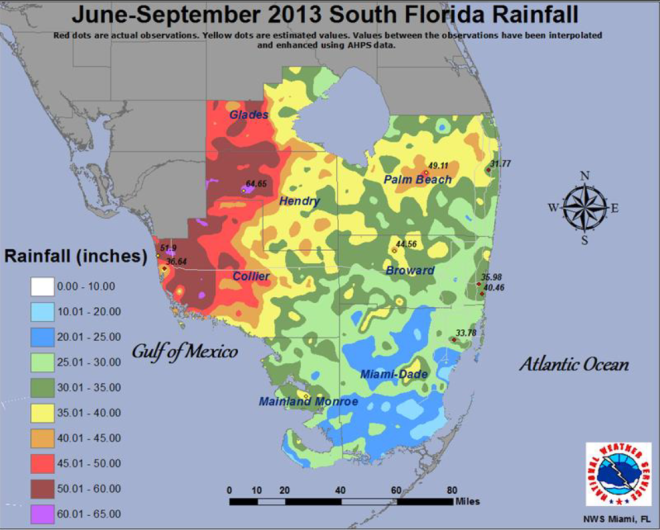
For those that do not know how the rainy season works here in south Florida, it generally runs from May 20th to October 15th (153 days). In that time, south Florida receives roughly 70-80% of the rainfall in a given year by virtue of daily thunderstorms and occasional tropical systems moving over us. Officially, the 2013 Rainy Season ran from May 18th to October 10th. This covered 146 days which is only 7 days below the average. There was a significant spread in rainfall totals across south Florida, two divisions even, with the west coast areas of Naples and Fort Myers receiving much more rainfall than the east coast areas such as Miami, Fort Lauderdale, and West Palm Beach.

Figure 1. South Florida rainfall distribution map (NWS Miami).

Figure 1. South Florida rainfall distribution map (NWS Miami).

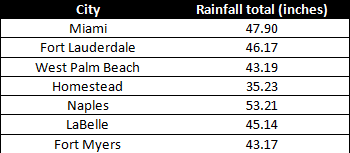
Table 1. Cities and rainfall totals from May 18th to October 10th.

Table 1. Cities and rainfall totals from May 18th to October 10th.

Shown in Figure 1, rainfall totals were greatest along the west coast metro areas, with values above 40 inches across most of that region. Meanwhile, east coast metro areas received slightly less rainfall totals, although isolated inland spots did receive more than 40 inches (Table 1). Every rainy season can vary in terms of rainfall distribution for the aforementioned reasons.

SIGNIFICANT WEATHER EVENTS

Tropical storm Andrea (5-8 June)

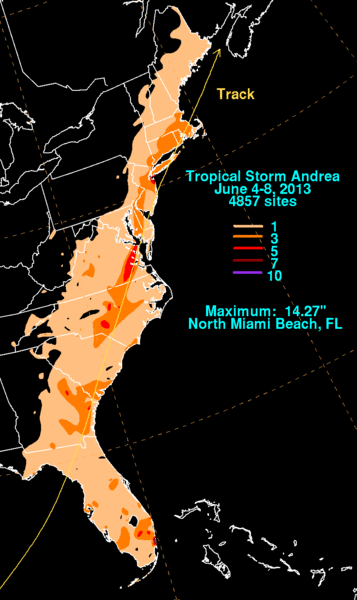
Tropical storm Andrea was the only tropical system to affect south Florida in any way. Making landfall near Steinhatchee, FL (around the Big Bend of Florida), south Florida was in the “dirty sector” of tropical systems (right front quadrant) and received a large amount of rain through the passage of the storm. While most of south Florida averaged at 2-4 inches of rain, a report from North Miami Beach showed that persistent rain dumped over 14 inches of rain! Flooding and severe weather affected the North Miami Beach area and would have receded slowly with passing time. Also, three tornadoes were reported with this storm. High shear and instability from the tropical storm helped to generate an environment favorable for the production of tornadoes; one of which was an EF-1 (65-85 mph sustained winds) reported in Palm Beach county.

Figure 2. Map of east coast of US with rainfall totals shaded in.

Figure 2. Map of east coast of US with rainfall totals shaded in.


Upper level low pressure systems (July)

July was dominated by a series of strong low pressure patterns (2 from the Gulf of Mexico and 1 in the Ohio Valley) that brought in an abundance of moisture from the Caribbean Sea due to a strong south to southwest wind flow. That, and by virtue of sporadic daily thunderstorms across the area, average rainfall totals ranged from 8 inches in Hendry County to as much as 16 inches in parts of Fort Lauderdale. Overall, July was the wettest month in the season for south Florida.

August “strange” rainfall distribution

2

August was a rather weird month for rainfall in south Florida. On one side of the spectrum, east coast areas such as Miami-Dade and Broward recorded one of their driest rainfall totals for the month while Collier and Hendry counties recorded one of their wettest Augusts on record. This was largely due in part to the Atlantic sea breeze being stronger than the Gulf sea breeze, and this drove more thunderstorms towards the inland and west coast areas while keeping the east coast areas relatively dry and sunny. Parts of Miami-Dade and Broward received 2-4 inches during the month while places such as Naples and Fort Myers received as much as 12-14 inches of rain! Talk about a distribution of extremes.

Excessive lightning in thunderstorms (September)

September was a return to near normal rainfall values for south Florida. However, the rainfall was accompanied by a very active electrical month in thunderstorm formation. Most thunderstorms that formed produced a significant amount of deadly lightning strikes. On 2 September, thunderstorms over Miami-Dade produced frequent “positive” lightning strikes (more dangerous than negatively charged lightning), killing one person and injuring two others. Also in Naples, lightning strikes significantly damaged a local YMCA building. 7 & 17 September saw a significant rain event come over the area, with rainfall totals as high as 11 inches collectively between the two days, especially over Naples, where some storms were stalled over the area through an extended period of time. Overall, most of south Florida received anywhere from 8-12 inches of rain, with the exception of Fort Lauderdale/Perry Airport (~4 inches of rain).

Slow moving trough rain event (2 October):

On 2 October, a late season trough associated with a mid-latitude cyclone travelled across the southeast. This produced significant instability across the area that spawned many thunderstorms throughout the day. Some isolated areas of Miami-Dade and Collier counties received more than 6 inches of rain, while most locales received about 2 inches of rain during this event. Overall, the month of October was relatively wet prior to the ending of the rainy season on October 10th.

Therefore, it was an above average rainy season for the duration it was. Although the air outside is still quite humid and warm, it can only last so long. Stay tuned for the weather discussion on Wednesday where there could be a potential cold front coming this weekend, which by the way, is unrelated to the predicted front that eventually fizzled out prior to arriving here.


Weather Discussion for 14 Nov- 20 Nov

Hello everyone. I am aware that I’ve had to postpone several posts to later dates but as I said, the schedule was subject to changes as time progressed. However, please stay with me as I am doing my best to keep up with or as close to the schedule as possible. Anyways, onto the good stuff, here’s the forecast discussion for 14 Nov- 20 Nov


CURRENT CONDITIONS

Figure 1. Current US surface analysis map from 14 Nov at 0000Z (7:00 PM EST).

Figure 1. Current US surface analysis map from 14 Nov at 0000Z (7:00 PM EST).

The cold front that has caused a wide cold snap across most of the eastern states has just recently cleared our area, trailing in a pool of cooler air as well as a strong northeasterly wind flow. In fact, according to the NWS Miami Facebook page, several areas had their lowest high temperature values not seen since 7 April and 2 May, such as Palm Beach (77), Naples (75), and Fort Lauderdale (79). Also, there has been a persistent NE wind over much of the area. Winds near 20 mph with gusts as high as 30 mph are being reported over most of the east coast beaches and metro areas, subsiding a bit as you get towards Naples and Fort Myers. However, this strong breeze has helped to draw in moisture from the Atlantic, and there have been some showers over the region. This pattern is expected to persist for most of the weekend and into next week.


15 NOV- 17 NOV

Figure 2. Projected surface analysis valid to 1200Z 17 Nov (7:00 AM EST).

Figure 2. Projected surface analysis valid to 1200Z 17 Nov (7:00 AM EST).

Taking a look out into the weekend’s projected surface map, a strong mid-latitude cyclone will begin to take shape over most of the Midwestern states with a cold front trailing into Colorado and New Mexico. This system is projected to continue to move eastward across the US. Meanwhile in south Florida, a stable high pressure system will continue to dominate the weather. With a strong E wind component, moisture will continue to filter into the area keeping the shower chances present. Shower chances look best for Friday and Saturday with each day at a 50% probability. Expect highs in the low 80s with lows in the upper 60s and low 70s for the weekend. This is important for those heading out to the NASCAR Ford Championship Weekend in Homestead.


18 NOV- 20 NOV

Figure 3. Same as figure 2, with validation to 1200Z 20 Nov (7:00 AM EST).

Figure 3. Same as figure 2, with validation to 1200Z 20 Nov (7:00 AM EST).

Figure 4. GFS model run at 1800Z depicting 2 meter above ground temperatures.

Figure 4. GFS model run at 1800Z depicting 2 meters above ground temperatures.


This is where things begin to get very interesting. Taking a look into the first half of next week, most model runs (particularly the GFS and UKMET) signal for an Arctic air mass to plunge into the US. This air mass has the potential to clear our area and usher in the first significant cool down of the dry season for south Florida. As seen in figure 4, the latest available GFS run has temperatures dropping to the 50s throughout the entire area (shown by the 15C isotherm over the peninsula). Also, a crisp north to northeasterly breeze will settle in as high pressure builds behind the cold front. At the moment, uncertainty remains high, but day temperatures may be in the 70s while lows will fall into the 50s for the first time since March and April.


Stay tuned to the forecasts on the Twitter feed. Until the next post, have a great end to the work week!


Weather Discussion for 7 Nov- 13 Nov

Hello everyone. Here is the forecast discussion for the period 7 November to 13 November:


CURRENT CONDITIONS

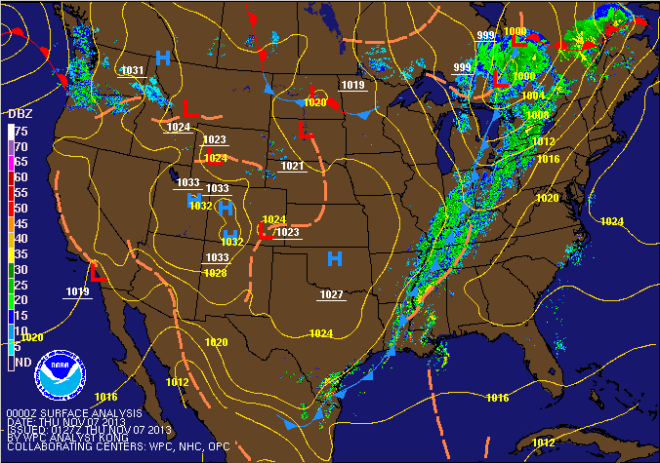
Figure 1. Current surface analysis as of 7 Nov 0000Z (7:00 PM EST).

Figure 1. Current surface analysis as of 7 Nov 0000Z (7:00 PM EST).

After what has been a rather windy start to the week, we’ve finally seen a decrease in wind and an increase in sunshine. The current surface analysis shows a cold front making its way through the Ohio Valley and parts of the Mississippi River area. Instability ahead of the front is making a mess over parts of Kentucky, Tennessee, and Indiana while just yesterday, the same front dropped large amounts of rain over parts of Oklahoma and north Texas. This frontal system will continue to progress eastward across the US and is expected to affect our area albeit in a weakened state.

Around us, a steady and strong easterly wind flow has been present over the last few days. This was due to the close proximity of the high pressure system over the Atlantic Ocean and close proximity of the low pressure system over the Caribbean Sea. This has since relaxed a bit as winds have subsided to below 15 mph. Also, the strong onshore flow helped to drive in some moisture from the Atlantic resulting in periodic scattered showers.

WEATHER OUTLOOK

7 November- 10 November

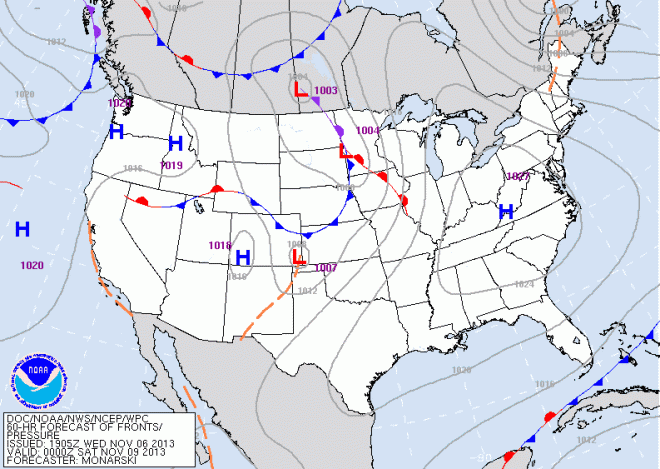
Figure 2. Surface analysis projected to 0000Z 9 Nov (7:00 PM EST 8 Nov).

Figure 2. Surface analysis projected to 0000Z 9 Nov (7:00 PM EST 8 Nov).

Taking a look at the weekend forecast surface analysis, the cold front that is currently nearing the southeast will approach south Florida on Friday evening and clear the area by Saturday morning. This cold front will be significantly weaker by the time it arrives, so we aren’t looking for much of a change in temperatures. However, temperatures are expected to return to near normal values, which are low 80s for highs and low 70s for lows. We could also see upper 60s in most inland locales over the early part of the weekend.

11 November- 13 November

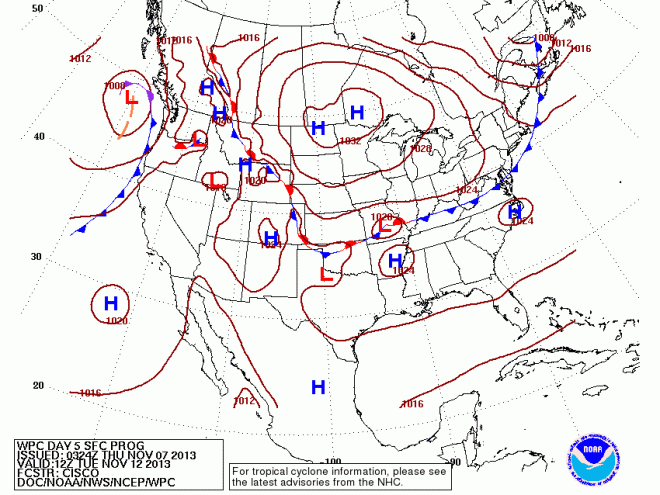
Figure 3. Same as Figure 2 but projected to 1200Z 12 Nov (7:00 AM EST).

Figure 3. Same as Figure 2 but projected to 1200Z 12 Nov (7:00 AM EST).

Figure 4. Same as Figure 3 but projected to 1200Z 13 Nov (7:00 AM EST).

Figure 4. Same as Figure 3 but projected to 1200Z 13 Nov (7:00 AM EST).

Figure 5. GFS Model run of 850 mb (5,000 feet) temperature profile projected to 1500Z 14 Nov (10:00 AM EST).

Figure 5. GFS Model run of 850 mb (5,000 feet) temperature profile projected to 1500Z 14 Nov (10:00 AM EST).


Looking further ahead into next week, the cold front is expected to fizzle out over northern Cuba as high pressure builds into the Atlantic waters off of the Carolinas. Winds are expected to increase over the second half of the weekend and into Veteran’s Day, primarily over the Atlantic coastal areas. Temperatures will remain near average. By the middle part of the week, computer models are in general consensus that a mid latitude cyclone will make its way through parts of New England. This will trail another cold front that will make its way towards south Florida, arriving around Thursday morning (Figs 3-4). Based on the preliminary GFS model run (Figure 5), temperatures will cool slightly compared to normal. We may see highs below 80 degrees for the first time since April and lows in the low to mid 60s across much of the area. However, this is still far into the future, so stay tuned for next week’s discussion.


Continue to check my Twitter feed (@BrianWxFLA) for forecasts and updates on our weather. Have a great Veteran’s Day!


Past Cooling Dates for South Florida

Hello and a good Monday everyone. I am inclined to believe that most of y’all have taken notice to the increasing winds outside. This increase in winds across the area is largely due in part to south Florida being squeezed between a high pressure system to the northeast and a low pressure system in the Caribbean. This change in pressure within a relatively short distance of each other is forcing winds to be stronger than normal, particularly across coastal & metro areas of Miami-Dade, Broward, and Palm Beach counties. This has even prompted a wind advisory until 1 PM tomorrow for coastal Miami-Dade, Broward, and Palm Beach counties where winds are expected to be sustained over 25 mph beginning tonight and persisting until tomorrow afternoon. The pressure gradient will subside gradually through the evening and be weaker by Wednesday, eventually tapering off by as early as Thursday night. Remember, these high winds can blow around small objects as well as make for dangerous driving conditions. Therefore, take extra precautions for safety.

Now onto the topic of this post. With the dry season in full force, it is easy to say that south Floridians are yearning for that first big blast of cooler air to arrive in our area. However, most of us have realized that we have yet to drop below 60 degrees, not even close really. This is all while our friends up in northern Florida have already seen several nights in the crisp 40s. So when does south Florida typically start to see temperatures below 60 degrees?

Figure 1 (courtesy of NWS Miami) shows average dates of cities in south Florida when 60 degrees or less temperatures are first observed.

Figure 1 (courtesy of NWS Miami) shows average dates of cities in south Florida when 60 degrees or less temperatures are first observed.

Apart from the fact that Fall is well underway, figure 1 shows the average start time for 60 degree lows or below. For the most part, late October to early November is the average. However, we’ve only dropped below 70 degrees just once and haven’t come even close to the 60 degree mark along coastal areas.

Weather Discussion for 31 Oct- 6 Nov

Hello everyone. Halloween is upon us and surely most of y’all are getting the costumes ready, the candies prepared, and the routes planned for the classic trick-or-treating bonanza. Here is the forecast discussion for the period 31 October- 6 November:


Current Conditions:

Figure 1. Current CONUS radar with pressure systems and frontal boundaries.

Figure 1. CONUS radar and surface analysis from 1200Z (8:00 AM EDT).

Figure 1 shows the most recent continental U.S. (CONUS) radar image and integrated surface analysis. A high pressure system over the Carolinas and Tennessee extends into the northern Caribbean which has kept an easterly to northeasterly breeze over south Florida. Rip currents along the Atlantic beaches have been designated from moderate to high risk over the past week due to the stiff onshore breeze. This has also kept any shower and thunderstorm chance at a minimum due to the strong stability pattern over the area, with the exception of a few stray showers around the evening time. This pattern is expected to persist for the next 24-36 hours.

A long line of convection stretches from Texas to Missouri. This is associated with a series of low pressure systems that are expected to track to the east over the next several days. Instability aloft in the surrounding region is causing some of these storms to reach severe characteristics, even prompting a severe thunderstorm watch box for parts of Oklahoma just yesterday. There is also a trailing cold front with this system and this has the potential to make it to south Florida.


31 October- 3 November

For the next 24-36 hours, we in south Florida can continue to expect these breezy and mostly sunny conditions. Highs are expected to remain in the mid 80s with lows in the upper 60s inland to the mid 70s near the coast.

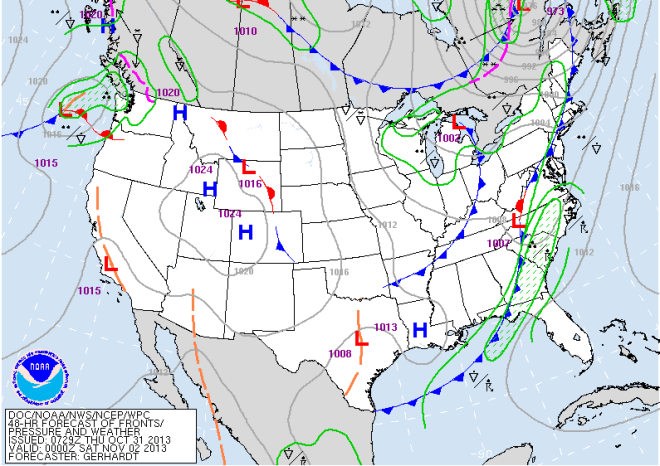
Figure 2. CONUS surface analysis for Friday evening (0000Z on Saturday)

Figure 2. CONUS surface analysis for Friday evening (0000Z on Saturday)

As the cold front begins to approach the state on Friday evening, the high pressure system over the Carolinas will weaken and drift back into the Atlantic. This shift will drive winds out of the southeast and south on Friday night and Saturday morning. This southerly flow will also bring in Caribbean moisture to the area, so the chance for showers and potentially a thunderstorm on Saturday will increase.

Figure 3. Same as figure 2, but validated for Sunday morning 1200Z.

Figure 3. Same as figure 2, but validated for Sunday morning 1200Z.

By early Sunday morning, the cold front will have passed our area and move into the Florida Straits. Shower chances will begin to decrease once the front swings through, and winds will shift to a north to northeasterly flow by the afternoon hours as high pressure behind the front begins to settle in over the southeast. Despite this front passing through, it is a weak front in terms of temperature swings as most of the models are in consensus that highs will still remain above 80 degrees for a large portion of the area. Lows may be expected to drop below 70 degrees for Sunday evening into Monday morning, but future model runs will detail more accurate information.


4 November- 6 November


Figure 4. Same as figures 2 and 3 but validated for Wednesday at 1200Z.

Figure 4. Same as figures 2 and 3 but validated for Wednesday at 1200Z.

By early next week and up to Wednesday, the high pressure system over the southeast will have built into the Atlantic waters. It is possible that this high pressure system will remain firm near south Florida, so the close proximity of that high pressure system to our area will cause the “pressure gradient”, or difference in pressures relative to our area and the system, to increase. This in turn will cause windy to very windy conditions, especially along the Atlantic coastal areas such as Miami Beach, Fort Lauderdale, and West Palm Beach. Rip current hazards will be present and of high risk, so anyone planning on going to the beach early next week should pay attention to the upcoming forecasts.

At this point, winds are expected to be easterly between 15-25 mph, with gusts as high as 35 mph in some areas. High temperatures will be in the comfortable low 80s, and lows in the upper 60s to low 70s, typical of this time of year. Humidity values are also expected to be lower than the prior week, so heat indices should not be much of a factor.


I will add the updated forecasts later this afternoon once a new model run comes through. Enjoy the Halloween festivities!


2013-2014 South Florida Dry Season Outlook

Hello everyone. This is the first post in about a good five months or so. As mentioned in my previous post, course work from the Spring semester and research duties at the University of Colorado had taken priority. However, there are many posts coming on and you can refer to that to see what will possibly be coming in the future. For now, that is a different story, so let’s get on with the topic at hand.

According to forecasters at the National Weather Service (NWS) office in Miami, the official start of the 2013-14 dry season began on 10 October. This was determined by the first “cold” front passage of the new season which helped to drop dew points into the upper 50s to low 60s over most of south Florida. The low dew point values made the humidity over much of the area bearable despite the air temperatures being in the still-warm mid 80s.  Low temperatures below 70 degrees were observed in many areas for the first time since early May. But the biggest change in the air is the ending of the daily thunderstorm pattern and a return to a drier and more stable environment.

In essence, the dry season is more specifically defined by the following:

  • Dewpoints below 65F degrees for more than 3 straight days.
  • Nightly air temperatures near 70F degrees or below.
  • Reduced precipitation days with several straight days of sunshine.

So now we can put the last 6 months of daily rainfall behind us and focus on the sunshine and cooler days ahead in the upcoming dry season. What can we expect this season? It may be too soon to tell, but we can use various models to get a better understanding of what may possibly lie ahead. I’ll do my best to try and explain the tricky stuff as efficiently as possible.

CURRENT OCEANIC CONDITIONS

Before getting to the forecasts, we must understand the origin of the conditions at hand. A large indicator of a phase presence is the standing of the sea surface temperatures (SST). The main reason we analyze this is because the SST values are one critical factor in determining the state of either an El Niño or La Niña. So you may be asking yourself, what is the difference between the two? What is so significant about each other? Below is a quick summary of this for both conditions.

In an El Niño phase, conditions are as follows:

  • SST values above +0.5C degrees from the norm.
  • Air pressure over the island of Tahiti and most of the Pacific Ocean.
  • Rising warm air over Peru with rainfall over the Peruvian deserts.
  • Trade winds in the southern Pacific weaken.

And these are the implications of El Niño’s presence:

  • Warmer and drier over the northern half of the USA and Canada.
  • Cooler and stormier over the southern half of the USA and northern Mexico.
  • Less active hurricane season in the Atlantic; More active hurricane season in the Pacific.

In a La Niña phase, the conditions and implications are practically the opposite of El Niño. South Florida has endured 2 La Niñas in the past 3 dry seasons (2011 & 2012). Between these two systems is the ENSO-Neutral phase, which lacks properties of both La Niña and El Niño. In an ENSO-Neutral phase, conditions across the Pacific remain relatively stable with little to no deviation in SSTs.

Average sea surface temperature (SST) anomalies as of 2 October 2013.

Figure 1. Average sea surface temperature (SST) anomalies as of 2 October 2013.

Figure 1 above shows the deviation from the normal sea surface temperature values on 2 October. It is noted that there is slight cooling along the equatorial Pacific Ocean with slight warming across the Western Atlantic and Gulf of Mexico. The spread is generally about -0.5C to +0.5C degrees from the norm.

Figure 2. Computerized Niño values.

Figure 2. Computerized Niño values.

An expansion of global SSTs and their departure from the norm can be better shown in Figure 2 (above). This figure describes a time progression of SST value departures from the normal for various coordinates on Earth. It follows this order (numbers in degrees, letters in the cardinal direction):

  • Niño 4: 5N-5S, 150W-160E
  • Niño 3.4: 5N-5S, 170W-120W
  • Niño 3: 5N-5S, 150W-90W
  • Niño 1+2: 0-10S, 90W-80W

These are all indicators of fluctuating SSTs in the Pacific and western Atlantic waters, which could lead to a better understanding of the conditions at hand. Using the guidance described above, we notice that there are deviations of +0.1C, -0.4C, -0.2C, and -0.4C degrees, respectively. The average of these four values is above the -0.5C degree deviation threshold. Therefore, we could be looking at a potentially ENSO-Neutral dry season over south Florida.

CLIMATE FORECAST FOR THE DRY SEASON

Because of the reduced confidence of wintertime forecasting, not much can be said about accuracy in the forecasts at this point in time. However, the folks at the Climatological Prediction Center (CPC) have drawn up a forecast for the next several months (up to 12 months actually, but we will stick with the next six months or so).

First half- November 2013 to January 2014
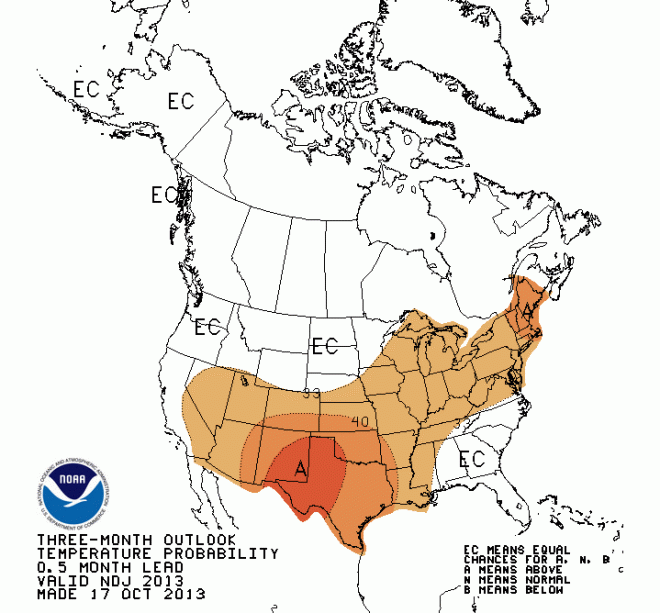
Figure 3a- Above/Below normal temperature forecasts for Nov-Dec-Jan

Figure 3a- Above/Below normal temperature forecasts for Nov-Dec-Jan

Figure 3b- Above/Below normal precipitation forecasts for Nov-Dec-Jan

Figure 3b- Above/Below normal precipitation forecasts for Nov-Dec-Jan

Based on the current SST values across the Pacific Ocean, ENSO-Neutral to very weak La Niña conditions will be felt here in south Florida, highlighted by the slightly higher (33%) chance of below normal precipitation over south and central Florida, and a moderate (40%) chance of below normal precipitation over northern Florida. Away from Florida, it is worth noting that this forecast also exists for Texas & Georgia and parts of New Mexico, the Carolinas and Arizona (see Figure 3b). As far as temperatures are concerned,  most of the southern portion of the country will have a slightly greater (33%) chance of seeing above average temperatures this winter, but south Florida has an equal chance (<33%) of seeing above and below average temperatures. Note that the conditions could be impacted with any change in the El Niño/La Niña index.

Second half- February to April 2014

Figure 4a- Same as figure 3a, except for Feb-Mar-Apr

Figure 4a- Same as figure 3a, except for Feb-Mar-Apr.
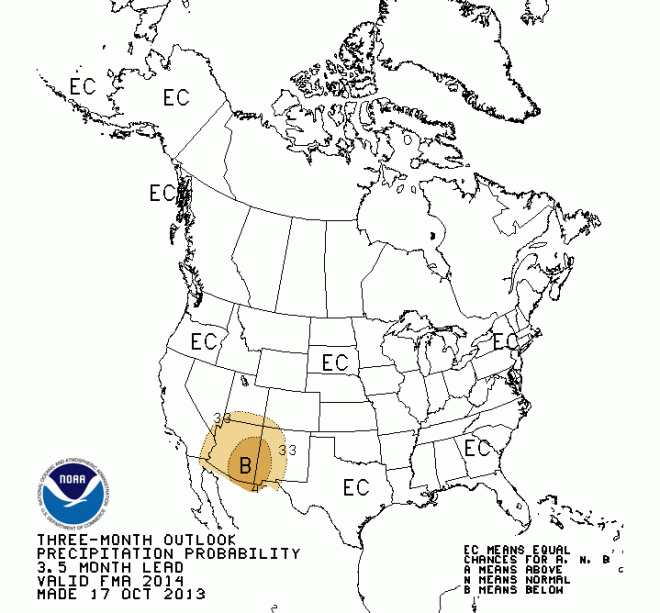
Figure 4b- Same as figure 3b, except for Feb-Mar-Apr

Figure 4b- Same as figure 3b, except for Feb-Mar-Apr

For the second half of the dry season, it appears that ENSO-Neutral conditions are more prevalent over the US, namely south Florida. There is a widespread area of an equal chance of above or below normal precipitation for the area throughout these three months (Figure 4b). This is the same for the temperature forecasts, remaining consistent with the 1st half of the dry season.

WHAT IS EXPECTED THIS DRY SEASON LOCALLY?

So having answered all of that, the answer to the question is this: South Florida is expected to have a drier start to the dry season than normal, followed by a return to more of a typical pattern of dry/wet conditions over the second half of the dry season. Here is the breakdown of individual events to look to in each half:

1st half of the dry season (November-January)

  • Increasing chances of stronger cold fronts as the winter gets closer and enters.

December and January are the two “coldest” months of the year for south Florida, with average temperatures below 70 degrees area wide (averaging maximum and minimum temperatures) The first freezes for south Florida (if any) occur in late December and the chance can persist into late January.  The most recent significant freeze threat occurred in December of 2010, where most of south Florida fell below the critical freezing 32F degree (0C) mark for 2-3 consecutive nights. South Florida’s risk of these significant fronts is slight relative to central and northern Florida, but it only takes one to do significant damage.

  • Cold fronts bring less instability as the time to winter approaches. But, the wind speed and direction still changes dramatically once the front passes.

A cold front that arrives in October typically has more instability than a cold front arriving in mid-December. Simply put, the surrounding air ahead of a cold front is more stable near the winter months as opposed to early Fall. Therefore, expect only light to moderate periods of rain ahead of a cold front closer to December and January. However, changes in the wind flow patterns are the same. A southerly wind ahead of the front will quickly switch over to a northwesterly wind and pick up in speed once the front clears the area. Temperatures will drop quickly once this occurs. Florida cold fronts are known to bring in windy conditions after all.

2nd half- February to April:

  • Wildfire threat increases dramatically.

As we clear the “coldest” months of the year for south Florida and temperatures begin to warm back up, the air above us will still remain very dry. As temperatures begin their return to the 80F degree mark, humidity levels may still remain comfortable (below 40% at times). Perhaps, too comfortable for large trees and fire to mix up easily. Wildfires are more prevalent between March and April, when the contrast between temperature and dewpoint is high. This “dry heat” is fuel for any wildfire to pop up in wooded areas. This would be time to exercise common sense and caution while around large trees and properties with trees.

  • Return to severe weather threat.

Instability in the air begins to increase as more heat is reintroduced during the spring months. Cold fronts do occasionally pass through south Florida, but they do not go quietly. Lightning, strong winds, heavy rains, and even the threat of tornadoes returns to the south Florida scene in the early to mid spring months. Florida’s peak in severe weather is usually April, so this would be the time to start paying close attention to the radars ahead of impending cold fronts.

———–

So that should cover it all for the first post back. Contact me on my twitter feed (@BrianWxFLA) if you have any questions regarding my posts. If there is any significant update to this issued by the CPC or NOAA, I will update and relay the information to you.

Onward and upward,

Brian

IMAGE CITATIONS:

National Center for Environmental Protection. ENSO Cycle: Recent Evolution, Current Status and Predictions. College Park, October 28, 2013.

NOAA Climate Prediction Center. Three Month Outlooks Official Forecasts. College Park, October 15, 2013.

I’ve returned & Upcoming tentative schedule of new posts

Hello everyone. Actually hello for the first time in about five months. Due to overwhelming coursework from the previous Spring semester and research conducted at the University of Colorado in Boulder, CO over the summer, I have had to take a long break from posting on this blog. It has been a busy last few months, but I’ve certainly learned a lot about weather that I never once knew. With all of that said, I’m looking to resurrect this blog back from the comatose state it has been in for the past five months, and I’m hopeful to get this blog back up and running with lots of information to talk about so that you, the reader and viewer of my page, can be well informed on the current-of-the-times weather in south Florida. I will try my best to get a weather discussion for the following week on Wednesdays. I will also be introducing some interesting topics of weather that I encountered during my stay in Boulder so that’ll be a good divergence from the norm. Therefore, I have created a draft schedule of topics to be discussed in the future posts. Keep in mind that this schedule is tentative due to academic workloads. Also as you may know, weather can change in the matter of a heartbeat, so topics may get pushed back or moved up depending on what is going on.

Schedule of specific posts (tentative):

28 October- “2013-2014 south Florida dry season outlook.”

31 October- Weather discussion for 31 Oct- 6 Nov

4 November- “Past cooling dates for south Florida.”

6 November-  Weather discussion for 7 Nov- 13 Nov

13 November- Weather discussion for 14 Nov- 20 Nov

+16 November- “2013 south Florida rainy season recap.”

+18 November- “Difference between summer thunderstorms in south Florida and in the Rockies & Flatirons of Colorado.”

20 November- Weather discussion for 21 Nov- 27 Nov

*26 November- Weather discussion for Thanksgiving weekend, 28 Nov- 1 Dec

1 December- “2013 Atlantic Hurricane Season recap.”

**4 December- Weather discussion for 5 Dec- 13 Dec

16 December- “Difference between humid subtropical and true tropical climates in Florida.”

18 December- Weather discussion for 19 Dec- 23 Dec

23 December- “End of the year weather discussion.”

*Will be posting the discussion on Tuesday in preparation for the holiday.

**Final exam week on campus. Will not be posting during this period.

+Moved due to  coursework.

Once again, content may change due to changing conditions and course workloads. However, I am excited to return to the blog and there will be plenty to talk about in the coming months! Onward and upward.

2013 South Florida Rainy Season Outlook

Hello y’all. First of all, it has been quite a while since my last post, due to priorities given to coursework and exams. But, that has concluded and hopefully I’ll be posting more frequently. I do have a host of topics to post (as mentioned on Twitter).

——————————————-

Well, as most of us in Florida know, the end of the dry season is fast approaching, and given the most recent stormy conditions, it may be quick to determine that the rainy season has finally commenced. That is not the case (I’ll explain later just why), but it is that time of the year where meteorologists begin to analyze the future months’ conditions for our local areas. The south Florida rainy season is characterized by the following nature:

A) Several months (mostly mid-May to mid-October) of hot & humid days and nights. Temperatures generally range from the upper 80s- mid 90s during the day and mid 70s- lower 80s at night.

B) Dewpoints are generally in the mid 70s.

C) Daily formation of strong thunderstorms over inland areas and slowly guided by either the Atlantic or Gulf of Mexico sea breezes, whichever is strongest at the given day.

D) Wind generally blows from the E/SE over the east coast areas, and out of the W/SW over the west coast areas.

E) 70% of the yearly precipitation occurs over this time period, either by daily thunderstorms or by tropical systems such as hurricanes.

CURRENT TREND

High pressure that settled in affirmatively over northern Florida for the last several days was due to the passing of a RARE LATE season cold front (emphasis on rare and late, since it is May). With the recent cold front that passed south Florida, it allowed dew points to drop back into the 50s, typical of winter time conditions. Consistent with this drop in dew points, the combination of clearing skies and a cool easterly breeze had taken control of our conditions. This will begin to change, as prevailing winds will begin to shift to the southeast and drive moisture back into south Florida.

SO IS THE DRY SEASON HERE TO STAY FOR MUCH LONGER?

No. We are nearly completing the transition into the rainy season, with a prelude given by the conditions most of us saw last week. In case you weren’t able to catch it, most of south Florida was, for several days, faced with severe thunderstorm formation. Several reports of hail were sent into the National Weather Service- Miami Forecast Office, and even an EF0 tornado touchdown in Broward county that did some damage.  Also, before this front passed, dew points were steady in the 70s, a key sign that the rainy season is at our doorstep. Not to mention, the Inter-Tropical Convergence Zone (ITCZ) is creeping closer to the waters close to us (that’ll be in a separate post).

Once this cold front energy dies out and high pressure returns to the Atlantic, a southeast wind flow will develop and that should drive in moisture from the Caribbean back into south Florida, hence the increasing humidity and dew points, which will then lead to increasing chances of showers and storms.

WHAT IS THE RAINY SEASON OUTLOOK?

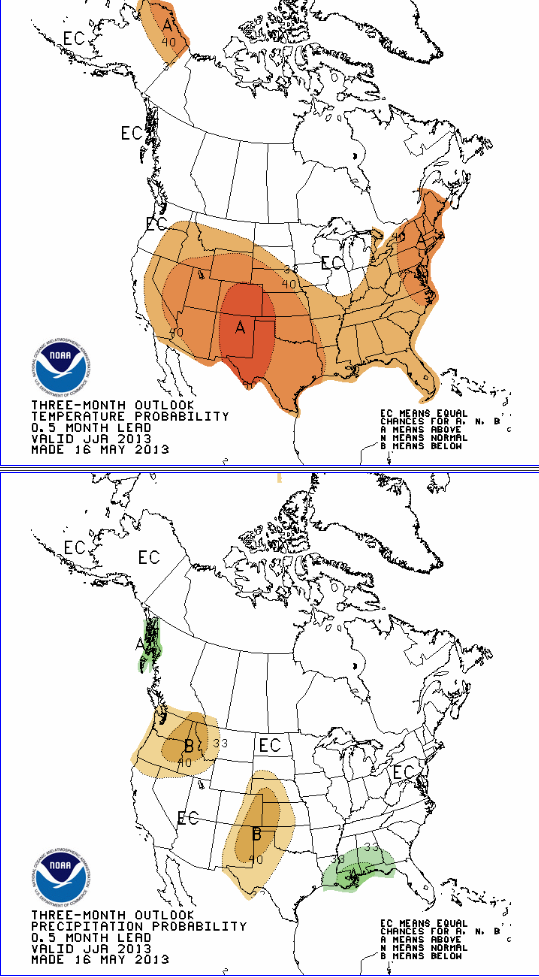
5-14-13 3

5-14-13 4

The National Weather Service-Miami Forecast Office just released their 2013 rainy season forecast. It is worth stressing that, before analyzing the diagrams, it is important to keep in mind that rainy season predictions generally are more difficult than dry season forecasts, simply in part by the higher quantity of influential factors. During the Winter and early Spring, the main focus for south Florida lies in:

-The approach of all cold fronts from the north, and any precipitation that may precede the passing of such fronts.

However, the late Spring to early Fall period consists of various factors, such as:

-Daily thunderstorm formation, some that are stronger and precipitation-rich than others.

-Tropical systems such as tropical storms and hurricanes.

-Warm front movement from the Caribbean driving in large pockets of rainfall.

-Westward migration of Saharan dust that acts as a convection suppressor.

And much more…

Because of all of the uncertainties that may be present during the actual season, most trends tend to lean on climatology. The first two pairs of diagrams [taken from the Climate Prediction Center (CPC)] show the probabilities of higher/lower/equal than normal temperatures and precipitation for the given period of time [in this case, June-July-August (JJA) & August-September-October (ASO)]. To put it into perspective, south Florida averages between 33-43″ of rain during the rainy season. Based on the CPC outlook, there is an higher chance of average rainfall for the JJA period for south Florida, and a higher chance for above average rainfall for the panhandle, while models favor above average temperatures state-wide. For ASO, rainfall is projected to be near average values state-wide, with a continuance of above average temperatures, possibly even higher for south Florida.

Weather Outlook for March 25-31

Good Sunday evening south Florida. Here’s the latest weather outlook for the upcoming week, which promises some interesting weather to begin Spring 2013.

SYNOPSIS

It goes without question that this past weekend was characterized by the unseasonably hot temperatures and humid conditions. In fact, Miami International Airport (KMIA) reported a high of 90 degrees today, tying the record high for March 24 set back in 1897! Most areas across south Florida maxed out in the mid 80s to low 90s, except the Naples area where the high was a more comfortable 81 degrees, largely aided by the persistent southwesterly (SW) wind flow. So why was it that south Florida was so warm to where it felt quite a lot like summertime?

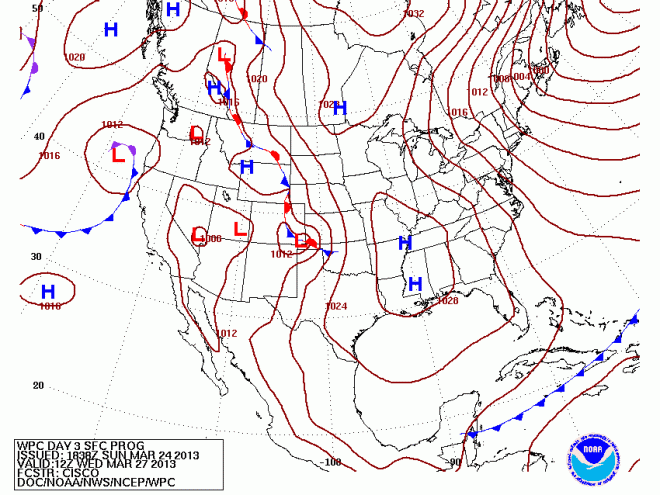
3-24-13 1

This was the surface analysis map taken earlier this Sunday morning. It shows that a warm front (located by the red semicircles along Georgia and the Atlantic Waters) has propagated northward (N) across Florida, and that has helped to drag up a considerable mass of maritime tropical (mT) air from the Caribbean waters. Any warm front that moves across the northern hemisphere will allow for the winds to veer (move counterclockwise) from the southeast to the southwest.  That wind flow helps to drag in moisture from the Gulf of Mexico, as well as the warmer air witnessed this weekend. At the same time, a cold front extending from the northern Mexican desert to the Florida Panhandle is bringing continental polar (cP) southward from its origins in Canada. This cold front is expected to clear south Florida and usher in colder and VERY dry air across the area (which I will discuss shortly after).

In the meantime, the combination of that warm air rising northward and that cold air sinking southward is helping to generate significant instability across most of the state, with rapidly moving severe thunderstorms across central Florida. These same severe thunderstorms forced the National Weather Service (NWS) forecast office in Melbourne, FL to issue a tornado warning for the Cape Canaveral, FL area earlier this afternoon (although no tornado formed), and the postponement of the final round of the Arnold Palmer Invitational Tournament at Bay Hill, FL until tomorrow morning. The squall line generated today was largely centered over central Florida, primarily north of Lake Okeechobee, before weakening as it headed further south. At this moment, the squall line is quickly weakening, although a light shower is still possible across the east coast metro areas. Also, a large portion of Florida was under a wind advisory today due to the pressure gradient formed by the low pressure system over Georgia. Winds in most areas were sustained at above 20 mph for a majority of the day, which can cause problems for drivers in SUVs or large trucks.

OUTLOOK

3-24-13 2

The current surface analysis shows that although the storms are ending across Florida, the cold front is lagging well behind, for it is still centered over the Tallahassee region. Nevertheless, it shall continue pushing southward through the overnight hours, and clear the Miami/Fort Lauderdale/Naples area by 11 AM tomorrow. At this time, given the current trends, morning lows across the area will be anywhere from 70-75 degrees. A later arrival of the cold front will allow for temperatures to rise through the morning, while a faster arrival will allow for temperatures to max out shortly after sunrise and steadily fall through the day. Therefore, the guidance consensus goes for the “middle man” estimate of a mid-morning frontal arrival.  Surely, winds are expected to start tomorrow out of the W and, once the front DOES move through,  winds will veer to out of the NW and begin to enforce the colder air and drying trend. It is possible that high temperatures may reach the low 80s in some areas prior to the frontal passage, but clearing skies will allow for good radiational cooling tomorrow night, and the drop in temperatures will certainly be felt as the night hours pass.

3-24-13 3

By Tuesday evening, the front will be well south of us and the cold, dry air mass will be in full command. Strong surface high pressure will set up over the Deep South, particularly between Louisiana to Missouri. This orientation of high pressure will drive NW to N winds across the state, leading to clear skies and excellent radiational cooling for Tuesday and Wednesday nights. There is a chance that some areas may experience record low temperatures for this time of year, since late March is not necessarily known for strong cold fronts as this one presents itself to be.

3-24-13 4

By the latter half of the work week, the high pressure system will build its way out towards the western Atlantic Waters. The surface pressures will begin lowering to seasonal levels, and a slow warming trend will be in store for the weekend as winds will veer to out of the NE and E by Friday afternoon. It is worth noting that although humidities will increase once again by the end of the week, drier air is expected to remain aloft, keeping thunderstorms out of the picture through next week.

Temperature forecasts are located in the graph below. Keep in mind that these forecasts are for the airport locations only. If you are further inland, the temperature may be a few degrees cooler, and vice versa for coastal locations. Also, the forecasts for the latter part of the week are not expected to remain constant, so check my Twitter feed for updated forecasts each day (search @BrianWxFLA).

3-24-13 5

As you can see, the coldest temperatures are expected between Tuesday morning to Thursday afternoon. Perhaps on Wednesday, temperatures may struggle to reach 70 degrees across the general area. N winds will help to disperse the heating on the ground during the day, and calm winds overnight will allow for excellent radiational cooling, leading to the chilly morning temperatures. Get those jackets out just once more!


For more information and detail into the forecasts, you can view the forecast discussions that the NWS forecast offices put out every morning at these respective links:

NWS Miami: http://forecast.weather.gov/product.php?site=NWS&issuedby=MFL&product=AFD&format=CI&version=1&glossary=1

NWS Melbourne: http://forecast.weather.gov/product.php?site=NWS&issuedby=MLB&product=AFD&format=CI&version=1&glossary=1

NWS Tampa Bay/Ruskin: http://forecast.weather.gov/product.php?site=NWS&issuedby=TBW&product=AFD&format=CI&version=1&glossary=1